


HDC Hyundai EP enriches customers' lives
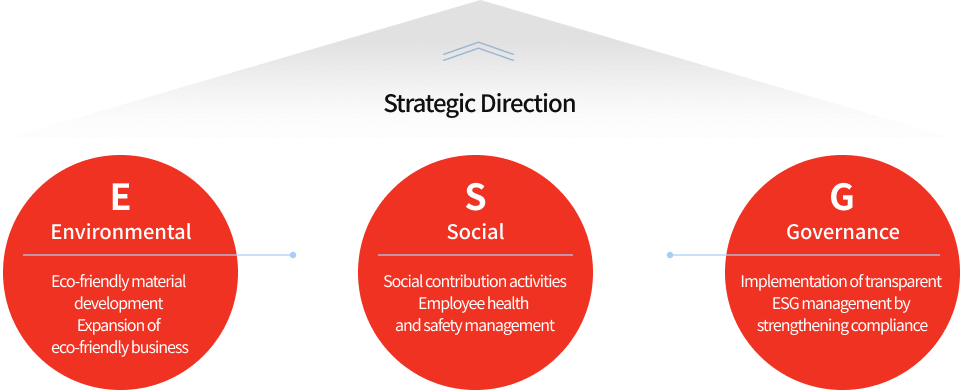
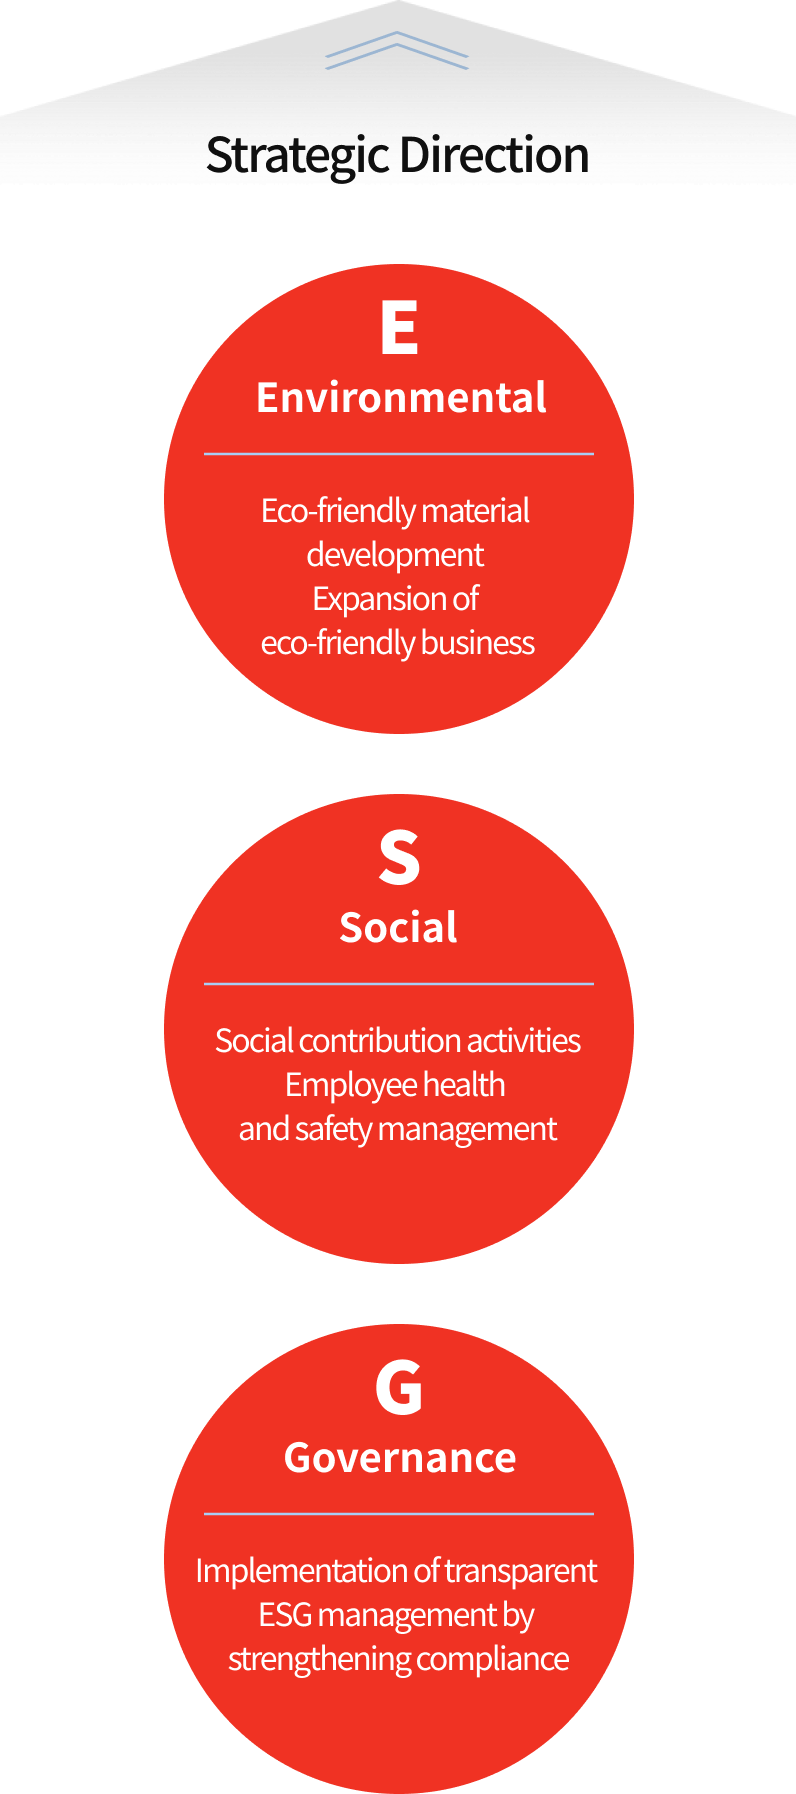
In order to respond to changes in the market environment, global policy climate, and consumption patterns, we set the mid- to long-term strategy as “strengthening ESG management fundamentals” and pursue sustainable management with a two-track approach.
Building a sustainable business model by strengthening ESG management
ESG Factbook
ESG Evaluation Ratings
| Assortment | ‘2022 | ‘2023 | ‘2024 | ‘2025 |
|---|---|---|---|---|
| Total Grade | C | B+ | B+ | B+ |
| Environment (E) | C | B+ | B+ | B+ |
| Social (S) | B | B+ | A | B+ |
| Governance (G) | C | B | B+ | B |
※ Evaluated by Korea Institute of Corporate Governance and Sustainability (KCGS)
※ Assessment levels : S, A+, A, B+, B, C, D
Environmental Data
| Assortment | unit | Data by year | ||||||
|---|---|---|---|---|---|---|---|---|
| 2023 | 2024 | 2025 | ||||||
| Goal | Outcome | Achievement rate of goal | Year-on-year change rate | |||||
| Energy concumption | TJ | 423 | 388 | 377 | 377 | 100.0% | -3.0% | |
| 1) Direct energy consumption | 160 | 87 | 84 | 86 | 97.6% | -0.7% | ||
| 2) Indirect energy consumption | 263 | 301 | 292 | 290 | 100.6% | -3.6% | ||
| Energy intensity | TJ/Ton | 0.002033 | 0.00212 | 0.002056 | 0.002163 | 94.8% | 2.0% | |
| Greenhouse gas emissions | tonCO₂eq | 22,948 | 20,720 | 20,098 | 19,199 | 104.5% | -7.3% | |
| 1) Scope 1 | 5,576 | 4,987 | 4,837 | 4,971 | 97.2% | -0.3% | ||
| 2) Scope 2 | 17,372 | 15,733 | 15,261 | 14,228 | 106.8% | -9.6% | ||
| Greenhouse gas emission summary | tCO2eq/Ton | 0.11030346 | 0.113217 | - | 0.110447 | 96.8% | -2.4% | |
| Water consumption(Industrial water) | ton | 217,252 | 177,121 | 171,807 | 185,787 | 91.9% | 4.9% | |
| Waste discharge | ton | 3,965 | 3,157 | 3,062 | 2,901 | 105.3% | -8.1% | |
| 1) Amount of waste recycled | ton | 3,909 | 3,107 | 2,923 | 2,774.04 | 105.1% | -10.7% | |
| 2) Amount of waste landfilled | ton | 56 | 50 | 139 | 127.23 | 108.4% | 155.8% | |
| Recycle rate of waste | % | 98.6 | 98.4 | 95.5 | 95.6 | 99.9% | -2.9% | |
| 1) Recycling rate | % | 98.6 | 98.4 | 95.5 | 95.6 | 99.8% | -2.8% | |
| 2) Landfill rate | % | 1.4 | 1.6 | 1.5 | 4.4 | -85.6% | 177.0% | |
| Chemical consumption | ton | 7.51 | 6 | 5.8 | 8.0 | 62.5% | 33.3% | |
| Hazardous Chemical consumption | ton | 193,821 | 171,491 | 166,346 | 163,143 | 101.9% | -4.9% | |
| Nitrogen Oxide(NOX) Emissions | ton | 5.087 | 2.513 | 2.438 | 4.385 | 20.1% | 74.5% | |
| Sulfur oxide(SOX) emissions | ton | 0.1 | 0.2 | 0.154 | 0.17 | 100.0% | 8.8% | |
| Particulate Matter(PM) emissions | ton | 3.243 | 2.683 | 2.603 | 2.102 | 119.2% | -21.7% | |
| Emissions of water pollutants_Total Organic Carbon(TOC) | ton | 5.861 | 1.917 | 1.859 | 1.638 | 111.9% | -14.6% | |
| Emissions of water pollutants_biochemical oxygen demand(BOD) | ton | 2.599 | 1.307 | 1.268 | 1.778 | 59.8% | 36.0% | |
| Emissions of water pollutants_Suspended Solids(SS) | ton | 6.121 | 1.997 | 1.937 | 2.582 | 66.7% | 29.3% | |
[The above environmental data is based on the information obligation provision of the ENV_INFO SYSTEM]
※ Performance goals aim for a 3% reduction annually compared to the previous year's internal management standards
※ Air pollution/water pollution substances are managed and maintained at 80% of the legal permissible concentration standards.
Eco-friendly Purchase/Sales Performance
| Category | Unit | 2024 | 2025 | |
|---|---|---|---|---|
| Recycled Materials | Purchase Amount | KRW 10 Million | 1,297 | 1,365 |
| Purchase Ratio | % | 2.02 | 2.27 | |
| Eco-friendly Material | Purchase Amount | KRW 10 Million | 922 | 1,262 |
| Purchase Ratio | % | 1.44 | 2.1 | |
| Eco-friendly Product | Sales Amount | KRW 10 Million | 356 | 310 |
| Sales Ratio | % | 0.44 | 0.39 | |
※ Criteria for Eco-friendly Purchases: ISCC PLUS certified products and recycled materials produced by GRS-certified sites (Scope Certificate).
※ Criteria for Eco-friendly Sales: Limited to ISCC PLUS certified products.
| Assortment | Total | Dangjin Plant |
Ulsan Plant |
Bundang Office |
Gwangju Office |
|---|---|---|---|---|---|
| Quantity of cars | 57 | 12 | 10 | 31 | 4 |
| Eco-friendly car | 21 | 4 | 3 | 12 | 2 |
| 1) Electric car | 1 | 1 | - | - | - |
| 2) Hybrid car | 20 | 3 | 3 | 12 | 2 |
| Normal Car | 15 | 4 | 4 | 7 | - |
Social DATA (Human Rights)
| Assortment | Unit | Data by year | Remarks (2025) | |||
|---|---|---|---|---|---|---|
| 2023 | 2024 | 2025 | ||||
| Total number of employees | Total | persons | 385 | 385 | 406 | |
| Male | persons | 343 | 341 | 359 | ||
| Female | persons | 42 | 44 | 47 | ||
| Executives | Male | persons | 8 | 10 | 9 | |
| Female | persons | - | - | - | ||
| General employees | Male | persons | 341 | 339 | 354 | |
| Female | persons | 37 | 39 | 42 | ||
| Temperary employees | Male | persons | 2 | 2 | 5 | |
| Female | persons | 5 | 5 | 5 | ||
| Spontaneous turnover of employees | % | 10.9% | 5.2% | 9.1% | ||
| Manpower composition of manager level |
Male | persons | 32 | 32 | 34 | |
| Female | persons | 1 | 1 | 1 | ||
| Employment Status of Disabled Persons | persons | 3 | 2 | 2 | 1 Technical Manager, 1 Staff | |
| Employment Status of Patriots | persons | 7 | 6 | 6 | 4 Technical Managers, 2 Supervisors | |
| Employment Status of Foreigners | persons | - | - | - | ||
| Employees subject to collective bargaining agreement | persons | 0 | 177 | 179 | Quarterly labor-management council held 4 times a year | |
| Number of union members | persons | 0 | 172 | 172 | ||
| Union membership rate | % | 0 | 97 | 98 | ||
※ The formula for calculating the employee turnover rate is spontaneous turnover of employees divided by the total number of employees. The standard for spontaneous turnover means leaving the organization at the discretion of the individual regardless of the will of the organization
※ To foster an inclusive work environment, the company aims to achieve a diversity workforce (persons with disabilities, foreigners, etc.) ratio of 3.0% relative to total employees by 2026. (As of 2025: 1.98%)
